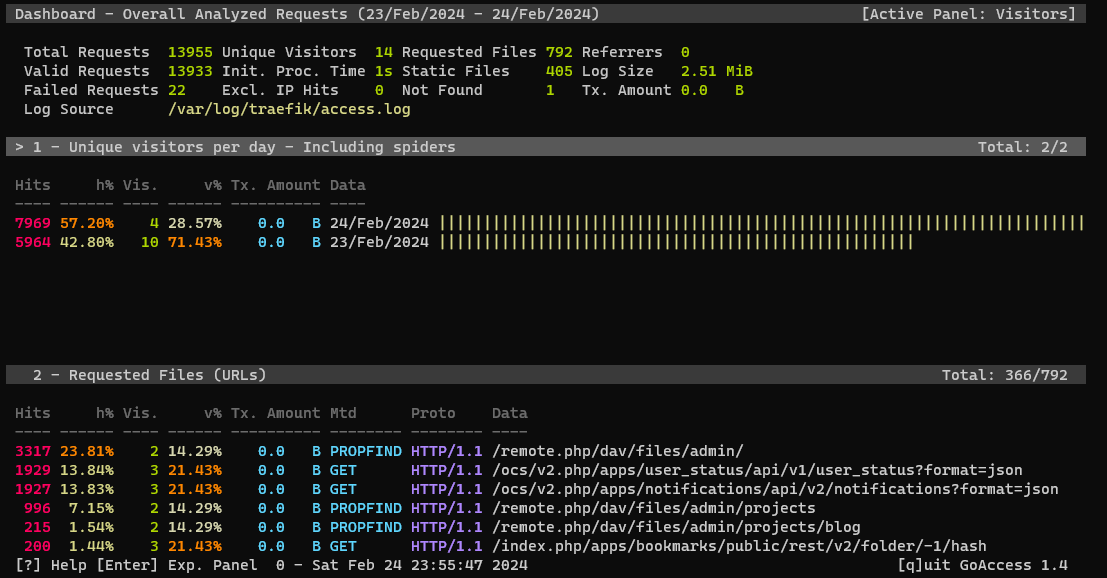
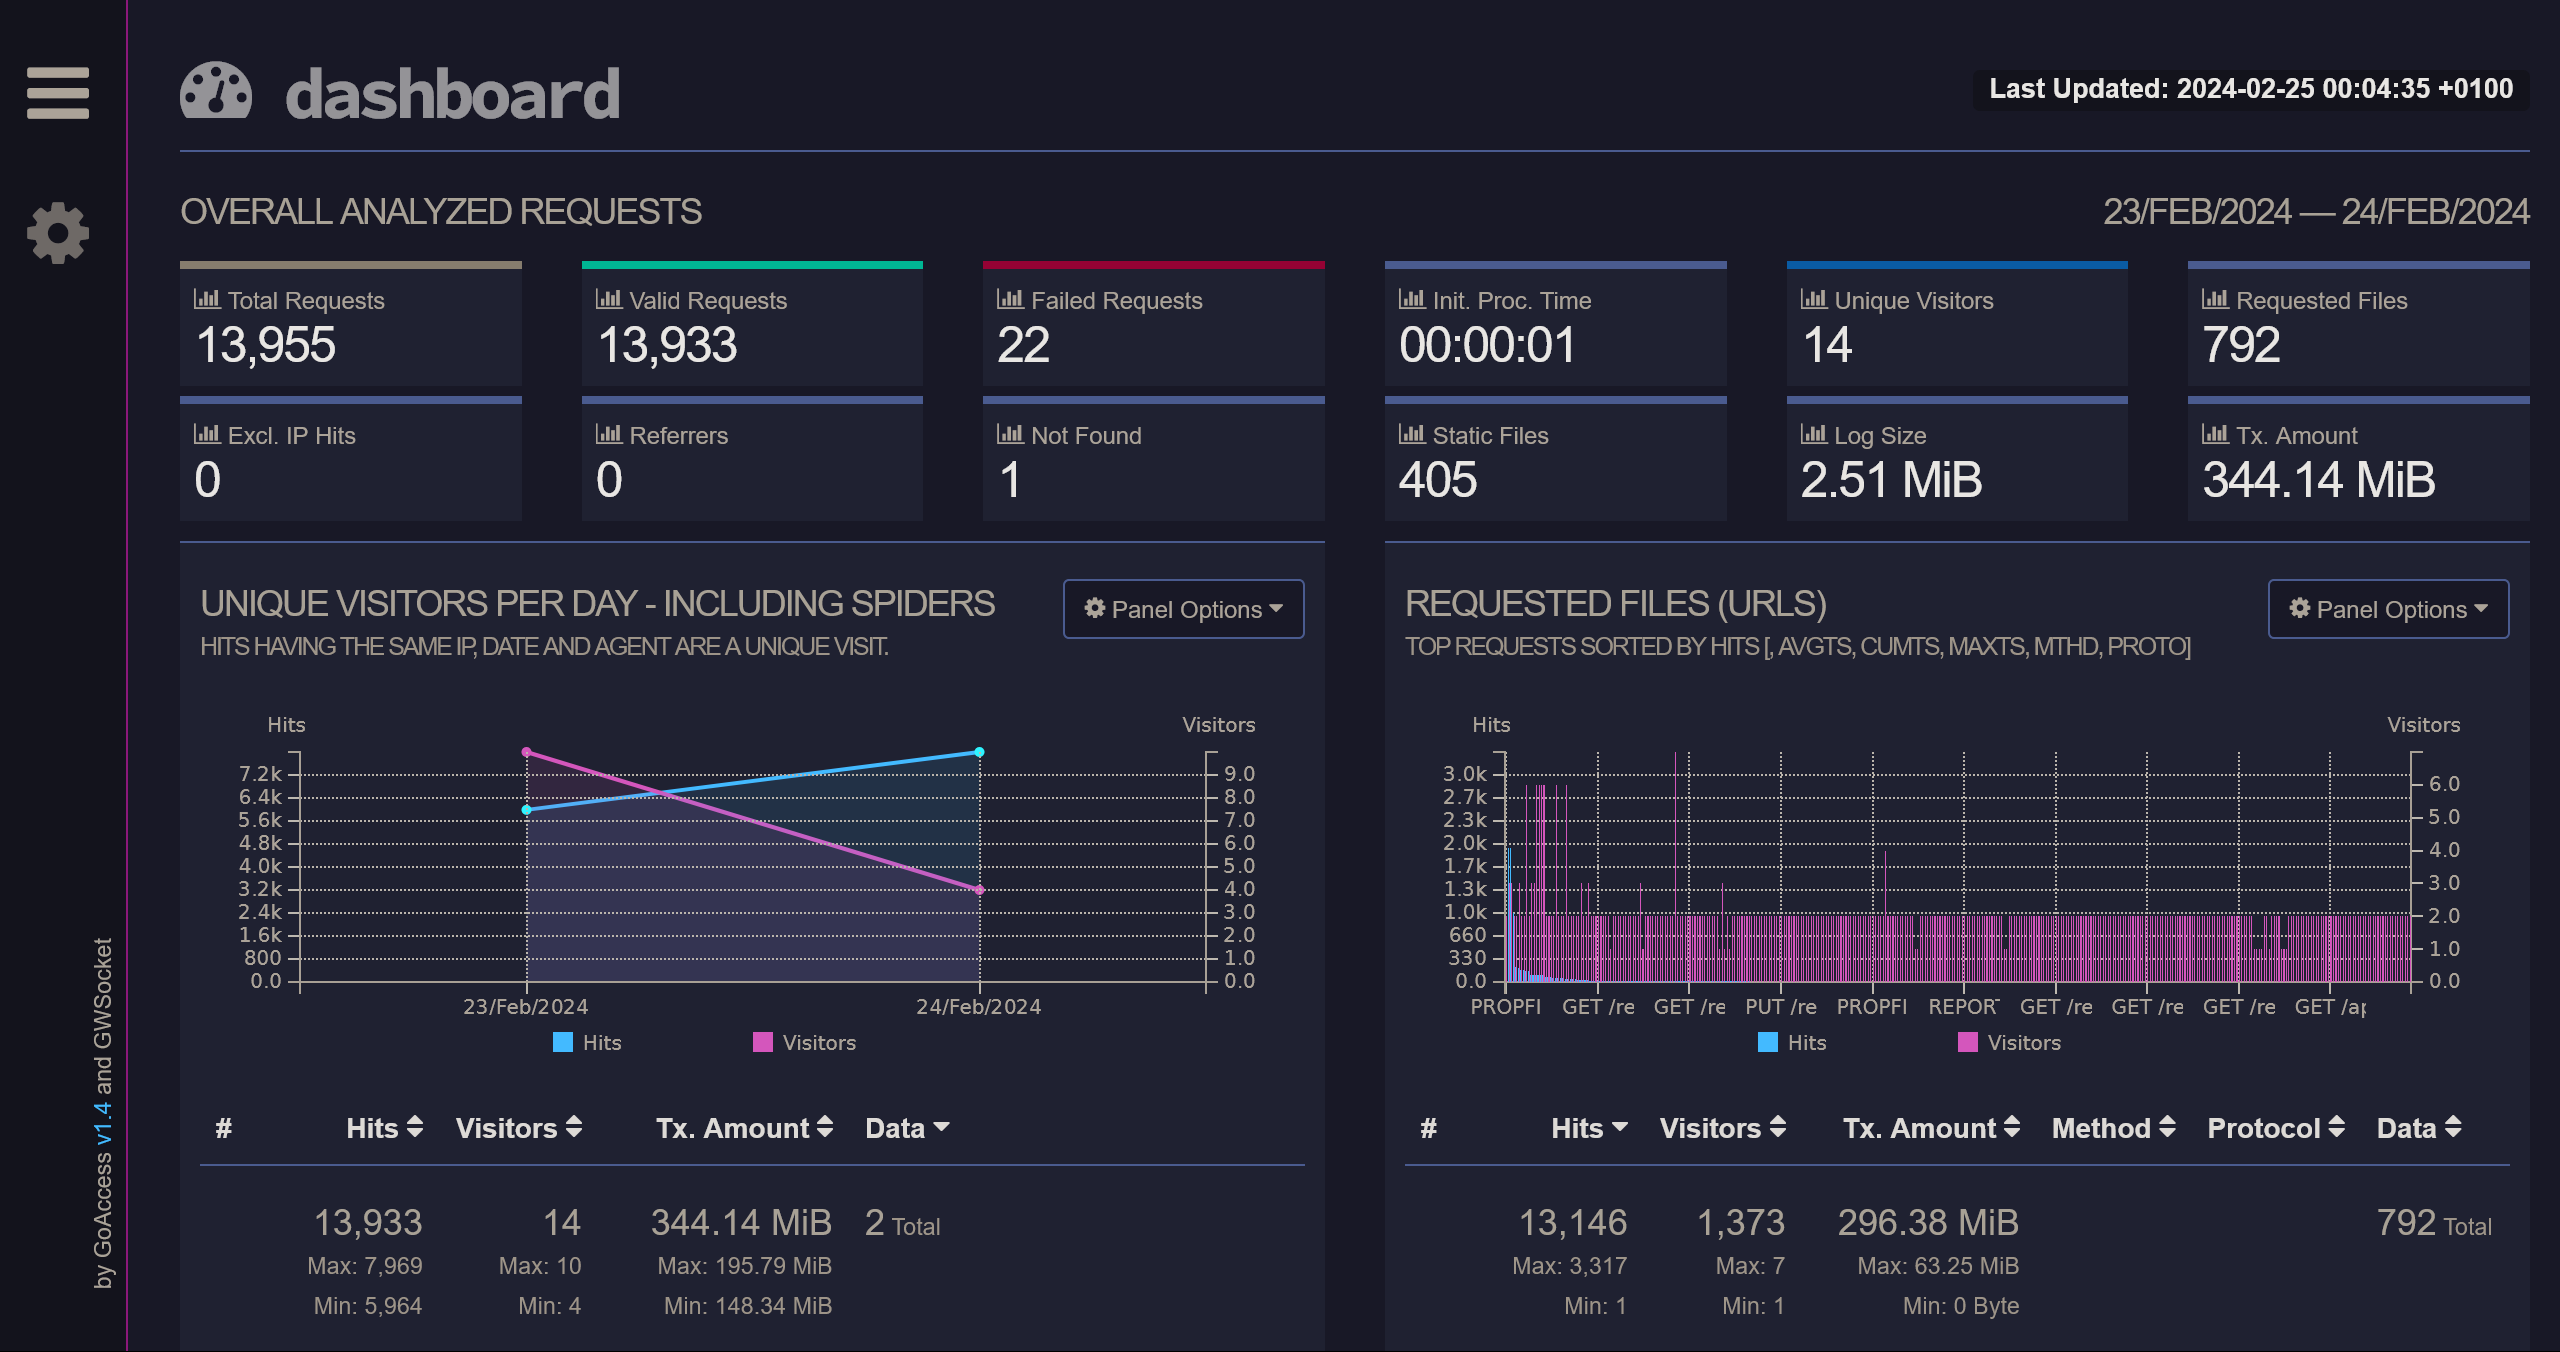
I wanted to have some analytics on the traffic going to my server. In general, the most popular choices among self-hosters are Plausible and Umami. With these kind of services, you get a tracking script that you add to your website. So my idea was to use Traefik, my reverse proxy of choice, to inject the script into the HTML of each of the applications I host. But after not finding an easy way to do it, I found an alternative solution with GoAccess. This is a tool that can read logs from multiple sources like Apache, Nginx, Caddy and Traefik and generate a simple report with it.
Setting up Traefik
First of all, you need Traefik to write the access logs to a file, since by default it writes to stdout. To do this, you need to add the following to your traefik.yml:
accessLog:
  filePath: "/path/to/access.log"
Or if you are using traefik.toml:
[accessLog]
  filePath = "/path/to/access.log"
If you are using proxying your traffic through Cloudflare, you will see that the IP addresses in the logs are from Cloudflare. To get the real IP addresses, you need to add the following to your traefik.yml:
entryPoints:
  web:
    address: ":443"
    forwardedHeaders:
      trustedIPs:
        - 173.245.48.0/20
        - 103.21.244.0/22
        - 103.22.200.0/22
        - 103.31.4.0/22
        - 141.101.64.0/18
        - 108.162.192.0/18
        - 190.93.240.0/20
        - 188.114.96.0/20
        - 197.234.240.0/22
        - 198.41.128.0/17
        - 162.158.0.0/15
        - 104.16.0.0/13
        - 104.24.0.0/14
        - 172.64.0.0/13
        - 131.0.72.0/22
And if you are using traefik.toml:
[entryPoints]
  [entryPoints.web]
    address = ":80"

    [entryPoints.web.forwardedHeaders]
      trustedIPs = [
        "173.245.48.0/20",
        "103.21.244.0/22",
        "103.22.200.0/22",
        "103.31.4.0/22",
        "141.101.64.0/18",
        "108.162.192.0/18",
        "190.93.240.0/20",
        "188.114.96.0/20",
        "197.234.240.0/22",
        "198.41.128.0/17",
        "162.158.0.0/15",
        "104.16.0.0/13",
        "104.24.0.0/14",
        "172.64.0.0/13",
        "131.0.72.0/22"
      ]
Using GoAccess
You can checkout how to install GoAccess here. For Debian/Ubuntu, you can install it with:
apt-get install goaccess
To get the statistics on your terminal, you can run:
goaccess access.log -c
This will give you the option to choose one of the predefined log formats, for Traefik, you will want to choose Common Log Format (CLF).

In the terminal, you can use TAB to scroll through the different statistics or select the one you want with 0-9 and Shift + 0. You can also use j and k to scroll up and down within each statistic.
Or if you prefer to send the statistics to a file, e.g. for an HTML file, you can run:
goaccess access.log --log-format=COMBINED -o report.html

You could then serve the HTML file with a web server or open it in your browser by copying it to your local machine with something like scp:
scp node:~/docker/traefik/report.html ~/Downloads/report.html
It also has the option to display the statistics in a real-time HTML report. To do this, you can run:
goaccess access.log --log-format=COMBINED -o report.html --real-time-html
Or if you are more of a Docker person, you can pipe the log from the external environment to a Docker process by running:
cat access.log | docker run --rm -i -e LANG=$LANG allinurl/goaccess -a -o html --log-format COMBINED - > report.html